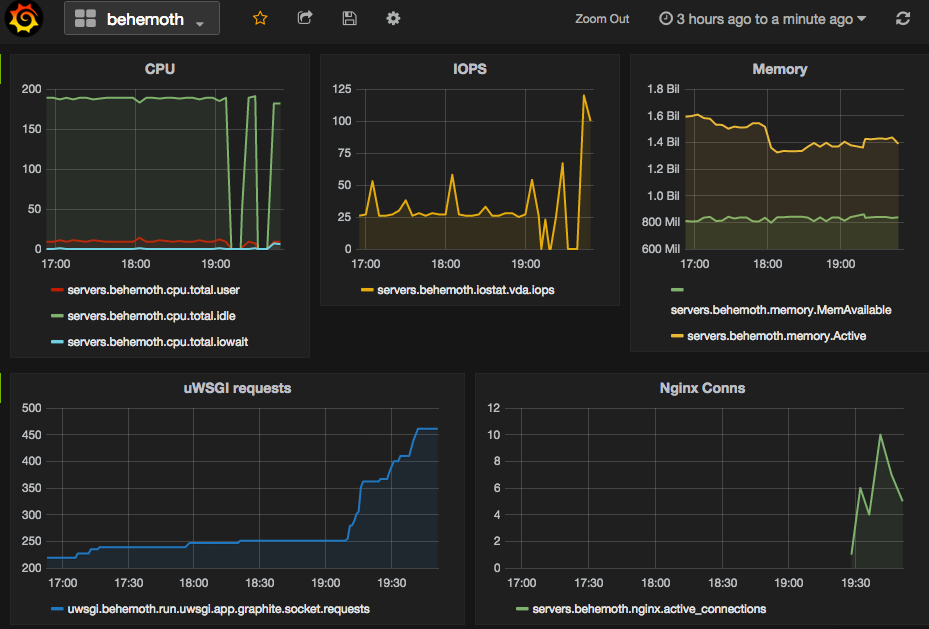
I have spent a bit more time tuning that setup so it works the way I want(tm). I have also decided that I no longer want to use the default graphite web UI but rather use grafana exclusively. The collector used here is Diamond. It has an extensive list of collectors to grab all the metrics.
First, start by setting up your graphite site in the backend, I allow it to be reachable only locally because Grafana will proxy the queries to it. So create /etc/nginx/sites-available/graphite and fill it with:
server {

  listen 127.0.0.1:8082;

  server_name  localhost;
  root   /opt/graphite/webapp/graphite;
  index index.html index.php

  access_log  /var/log/nginx/graphite.access.log;
  error_log  /var/log/nginx/graphite.error.log;

  location / {
                gzip off;
   include uwsgi_params;
   uwsgi_pass   127.0.0.1:3031;
  }

}
You then need to install grafana where you see fit, in this example, I put it under /opt/grafana. Then create /etc/nginx/sites-available/grafana
server {

  listen 80;

  server_name  grafana.frlinux.net;
  root   /var/www/html;
  index index.html index.php

  access_log  /var/log/nginx/grafana.access.log;
  error_log  /var/log/nginx/grafana.error.log;

  location / {
   proxy_pass http://localhost:3000;
  }
You will of course still need to set up grafana, i will refer you to the official documentation.
Symlink the 2 sites under sites-enabled then restart nginx. Et voila !